111 SEO Statistics For SaaS Companies
The SaaS landscape is evolving at lightning speed, and so is the role of SEO in driving sustainable growth. With rising acquisition costs, longer buyer journeys, and increasingly competitive search results, SEO has become a strategic pillar for scaling SaaS businesses.
Whether you’re looking to increase organic traffic, improve content ROI, or reduce reliance on paid channels, understanding the latest data can give you a competitive edge.
In this article, we’ve compiled the most important and up-to-date SaaS SEO statistics, from user behavior and content trends to Google search dynamics and conversion benchmarks.
These insights will help you shape smarter SEO strategies, create better content, and build experiences that actually convert.
SaaS Market Statistics
- The US SaaS market is projected to surpass $445 billion by 2029 (Semrush)
- AI software is the biggest SaaS sector based on customers, with 3 billion (Semrush)
- Organizations use 112 SaaS apps on average (BetterCloud)
- The average B2B SaaS churn rate is -1.59% (Semrush)
SaaS User Spending Statistics
- Global user spending on SaaS is estimated to reach over $295 billion in 2025. (Statista)
- In 2024, businesses spend around $8,700 per employee on SaaS products. This is up from $7,900 in 2023. (Vertice)
- 45% of SMBs report spending up to $600,000 annually on SaaS. While around 16% spent up to $2.4 million. (Statista)
- The cost of SaaS solutions has increased by 33% since 2021 (BetterCloud)
- Globally, the SaaS inflation rate is almost four times higher than the standard market inflation rate (Vertice)
SaaS and Audience Behavior Stats
- SaaS buyers will often spend 27% of their time conducting research online throughout the buying process.
- 47% of buyers will view 3 to 5 pieces of content before engaging with a company’s sales representative.
- More than 30% of SaaS subscribers will cancel their subscription within the first three months.
SaaS SEO Statistics
- Organic search is still the #1 traffic source for websites. (HubSpot)
- B2B SaaS has an SEO ROI of 702% and breakeven average of 7 months.
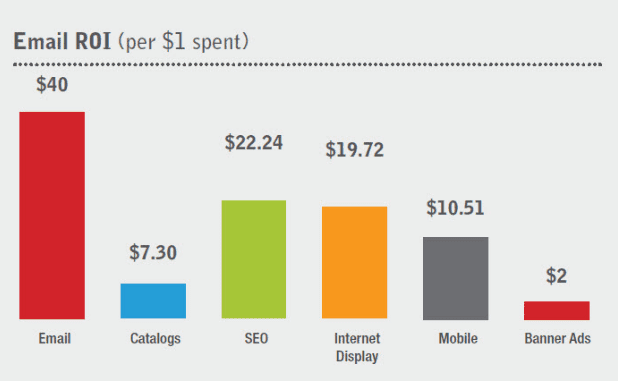
- For every dollar spent on SEO, businesses earn an average of over $22, per stats from (SmartInsights)
- In 2024, SEO helped improve the website performance and marketing efforts of 91% of businesses. (Conductor)
- In 2023, 66% of B2B buyers relied on search engines to find solutions before buying a product. (Statista)
- 68% of all online experiences begin with a search engine. [BrightEdge]
- Up to 46.5% of the webpages that Google’s AI Overviews cite rank outside the top 50 organic results. [Advanced Web Ranking]
- Over 53.3% of website traffic comes from organic search. [BrightEdge]
- SEO drives over 1000% more traffic than other channels like organic social media. [BrightEdge]
- 60% of marketers cite inbound marketing as their top source of high-quality leads. [HubSpot]
- B2B buyers consume 3-7 pieces of content on average before speaking to a salesperson. [Demand Gen Report]
- 40% of marketers say content development is their most pressing SEO issue. [North Star Inbound]
- The first result on Google’s search engine results page (SERP) gets approximately 27.6% of all clicks. [Backlinko]
- 61% of marketers say their primary SEO goal is lead generation. [Conductor]
- Over 14 billion searches are made on Google each day. [Search Engine Land]
- 84% of B2B marketers say content creation is the top content marketing activity they outsource. [Content Marketing Institute]
- 32% of respondents said they don’t have a person dedicated to running their content marketing campaigns. [Content Marketing Institute]
- 70% of marketers say they focus on all three aspects of SEO when conducting their SEO audits. [Databox]
- When asked which channel provides better quality leads, 81.2% of respondents chose SEO over PPC. [Databox]
- Over 92% of keywords get fewer than 10 monthly searches. Don’t discount zero-search volume keywords in your strategy. [Ahrefs]
- 70% of SEO professionals report to clients monthly, focusing on organic traffic, keyword rankings, and conversions.
- Companies generate two times more revenue from organic search traffic than other sources, like social media.

SaaS SEO Keyword Research Statistics
- In 2024, almost 60% of EU Google searches and over 58% of American ones resulted in zero clicks. (SparkToro)
- Search intent: 52.65% of Google searches are informational, 32.15% are navigational, 14.51% are commercial, and 0.69% are transactional. (Datos)
- Long-tail keywords make up 70% of all search traffic. (Embryo Agency)
- On average, 69% of clicks go to the first 5 organic search results for any keyword. (Up Inc.)
- Branded terms make up over 44% of Google searches. (Datos)
- In the U.S., more than 80% of queries are between 1-3 words. (Statista)
- Pages that occupy the top 10 of Google search results have a 50% lower keyword density than those ranking 2 years ago. (BrightEdge)
Google Search Statistics
- 92% of global traffic comes from Google. (Semrush)
- With a market share of 81.95%, Google continues to dominate the global search engine market. By contrast, Bing has 10.51%, Yahoo has 2.67%, Yandex accounts for 2.42%, DuckDuckGo has 0.60%, and Baidu represents 0.53%. (Statista)
- Google processes over 8.3 billion searches a day, 96k+ per second, and 5.7+ million per minute. (Exploding Topics)
- 20 billion search queries a month are performed using Google Lens. (Think With Google)
- AI Overviews reach over 1 billion users each month. (Think With Google)
- 400 billion: The size of Google’s index of web documents, as reported by Zyppy SEO, citing the USA vs. Google antitrust trial.
- Every day, 15% of Google searches use keywords never used before. (Think With Google)
- 54% of all clicks go to the first 3 Google search results. (Up Inc.)
- Just 0.44% of Google users visit the second page in search results. (Backlinko)
- 32.3%: the click-through rate boost that can be achieved by ranking one spot higher on page 1 of Google SERP. (Backlinko)
- Almost two-thirds (63.41%) of all U.S. internet traffic is referral traffic from Google.com. (SparkToro / Datos)
- Organic search accounts for 53% of website traffic. (Embryo Agency)
- 75% of Google users ignore the 2nd page of results. (Hubspot)
Google Search vs. Generative AI Statistics
- 99% of those using generative AI platforms continued to use search engines (Datos)
- In 2024, Google received 373x as many searches as ChatGPT. (SparkToro)
- Around 16.4% of search users also use GenAI. The data, however, doesn’t indicate they use AI “instead of traditional search.” (Datos)
- In January 2025, AI Overviews appeared in 30% of search results and 74% of problem-solving queries. (Search Engine Journal)
- In a recent study, Google Search had 290 times more users than Perplexity. (SparkToro / Datos)
- The percentage of search engine users that also use generative AI platforms is in the low double digits. (Datos)
- ChatGPT continues to see the most growth of all GenAI platforms, followed by Gemini, Copilot, Claude, and Perplexity. (Datos)
- From May 2023 through May 2024, ChatGPT saw a combined desktop and mobile web MAU growth of 25%. (Datos)
- In 2023, generative AI attracted equity investments of $36 billion, up from $5 billion in 2022. (McKinsey Global Institute)
- Google vs. AI: Google Search users sparked an average of 200 events per month, followed by Perplexity users who averaged 15 events per month. ChatGPT users averaged 12.2 events. (Datos)

SEO CRO Statistics
- URLs that contain the target keyword or similar have a 45% higher CTR than those without.
- Title tags with 40-60 characters have the best CTR.
- Titles with a positive emotional sentiment result in a 4.1% higher CTR.
- Long-tail keyword use generates a 3-6% better CTR.
- 50-65% of pages in the number one ranking position are featured snippets.
- Pages that rank in first position have 3.8 times more backlinks than the following ranks.
- The average page loading time for those on the first page of search results is 1.65 seconds.
- 72.3% of sites studied by Ahrefs have a slow loading speed.
- 88% of users are unlikely to return to a website after a bad user experience, such as slow page loading time.
- Long-form content attracts 77.2% more backlinks than short content pieces.
SaaS UX Statistics
- 75% of consumers judge a site’s credibility based on how it looks.
- 88% say they wouldn’t return to a website after having a bad user experience. The same holds true for SaaS apps. (The UX school)
- 74% of SaaS got negative G2 reviews about their user interface. (Luzmo)
- 54% of users want to see content that is personalized to their interests. (Adobe)
- Every $1 spent on UX design will generate $100 in return. (Forrester)
- 45% of users expect content to display correctly across different devices. (Adobe)
SaaS Content Marketing Statistics
- SaaS companies will spend between $342,000 and $1,090,000 annually on content marketing.
- Within the first three years, SaaS companies will spend 75% of their revenue on sales and marketing.
- SaaS companies that prioritize content marketing report a lead generation growth of up to 400%.
- Approximately 37% of SaaS marketing professionals say that their biggest challenge is providing engaging visual content consistently.
- Blogs can contribute to 434% more indexed pages and 97% more indexed links.
- For 57% of SaaS companies, creating content is a key marketing strategy, and SEO brings in 14.3% of leads from organic search
- 42% of marketers report that updating existing blog content will boost your marketing value.
- Especially for newer blogs and companies, aiming for 6-8 posts a month is a great way to create topic clusters that align with your brand.
- In the SaaS sector, the most successful blogs have an average of 3,000 words.
- According to 72% of marketers, the most effective SEO tactic is publishing high-quality content. (WebFX)
- By 2027, the global content marketing industry is projected to grow by over $584 billion. (ReportLinker)
- Businesses that spend $4,000 or more per article are likelier to report content marketing success vs. those who spend $500 or less. (Siege Media)
- 62% of businesses outsource their content marketing. (DemandMetric)
Backlink Statistics
- Websites with “active blogs” get 97% more inbound links. (BKA Content)
- Pages that rank #1 in Google have, on average, 3.8 times the number of backlinks than pages in slots 2 through 10.(Backlinko)
- Over 66% of backlinks are broken. (Ahrefs Link Rot study)
- Almost 80% of SEO professionals view link building as a crucial part of their strategy. (Authority Hacker)
- 78% of SEO professionals get “satisfying ROI” from link-building campaigns. (Authority Hacker)
- 43 trillion: the number of backlinks that Semrush has in its database. (Semrush data)
Mobile SEO Statistics
- Google accounts for 95% of the mobile search engine market (GS Statcounter)
- 96% of internet users, or 4.97 billion people, access the web via mobile devices. (Status Labs)
- Globally, on a monthly basis, mobile users account for 59% of all internet traffic. In North America, they account for 45%. (Statista)
- Mobile internet traffic as a percentage of total traffic is highest in Africa (74%), Asia (69%), and South America (56%). (Statista)
- 80% of top-ranking sites are mobile-optimized. (Status Labs)
- YouTube has a mobile audience reach of 74%, followed by Gmail (65%) and Facebook (64%). (Statista)
Technical SEO Statistics
- 7.4% of pages ranking in the top 10 of Google don’t have a title tag. (Ahrefs title tags study)
- Google rewrites 61% of titles displayed in SERP. (Zyppy study)
- 87.7% of websites use HTTPS. (W3Techs)
- Over 23% of websites use no structured data. (W3Techs)
- Of sites that do use structured data, 67.7% use Open Graph, 52.4% use Twitter Cards, 49.7% use JSON-LD, 39.3% use generic RDFa, 25% use microdata, 0.9% use Dublin Core, and 0.4% use Microformats. (W3Techs)
From the dominance of organic search in traffic generation to the explosive growth in SaaS user spending, one thing is clear: SEO is no longer optional, it’s foundational. SaaS companies that invest in technical SEO, UX, and content-led strategies are seeing compounding returns in the form of lower CAC, higher LTV, and predictable pipeline growth.
Whether you’re a startup fighting for visibility or a scale-up refining your marketing mix, use these stats as both a benchmark and a roadmap.
The future of SaaS growth belongs to brands that rank, resonate, and retain.

FAQs
Why are SEO statistics important for SaaS companies?
SEO statistics help SaaS companies understand market trends, benchmark performance, and make data-driven decisions for content strategy, keyword targeting, and ROI forecasting.
What are the most important SEO KPIs for SaaS?
Important SEO KPIs for SaaS include organic traffic growth, conversion rate, keyword rankings, backlink quality, bounce rate, dwell time, and pipeline-influenced revenue.
How is GenAI impacting SEO strategies in 2025?
GenAI is transforming how content is generated, optimized, and surfaced in search. Tools like SGE and AI search snippets require SaaS companies to optimize for semantic intent, structured data, and LLM-friendly formats.
Is SEO still a good investment for SaaS?
Yes. According to industry data, SEO continues to deliver one of the highest ROIs for SaaS, compounding over time and reducing CAC as organic traffic scales.
What percentage of SaaS traffic comes from SEO?
On average, SEO drives 20–40% of total traffic for SaaS companies, depending on the maturity of the SEO function and the competitiveness of the niche.

